Lesson 11 - The Graphics Windows
GPSS World allows you to view, and interact with, simulations through any of 17 graphics windows—many of which have more than one flavor. In addition, there are four windows for input and output. Of the graphics windows, 10 are updated as the simulation runs, and the others are snapshots that allow you to capture a view of the simulation at one point in time. Except for the User Stops Snapshot, the Snapshot Windows are not available in the Student Version. Additional information about the Graphics Windows can be found in Chapter 5 of the GPSS World Reference Manual. When viewing the on-line windows, you are actually viewing the current state of the simulation. The GPSS World graphics windows are:
The Blocks Window — a view of GPSS Block entities.
The Expressions Window — a view of any PLUS Expression that you wish to watch as the simulation runs.
The Facilities Window — a view of GPSS Facility Entities.
The Logicswitches Window — a view of GPSS Logicswitches.
The Matrix Window — a view of a GPSS Matrix Entity.
The Plots Window — a view of up to plotted PLUS Expressions.
The Queues Window — a view of any Queue Entity in the simulation.
The Savevalues Window — a view of any defined Savevalue in the simulation.
The Storages Window — a view of GPSS Storage entities.
The Table Window - a view of GPSS Table or Qtable Entity in histogram form.
In addition to the dynamic windows listed above, there are snapshot capabilities of a single Transaction, the CEC, FEC, Transaction and Numeric Groups, and Userchains.
All graphical windows allow you to interact with the simulation using your mouse. The Snapshot Windows show a view of the simulation at a given point in time and are not updated on-line. They can give you valuable information about a single Transaction, the Transactions on various chains and in groups in your simulation.
In this lesson we will systematically go through the operations possible in the graphical windows. In earlier lessons, we have used the graphical windows for various views of our sample models. In this chapter we will try to look at each of the windows that can be accessed, in their detailed and non detailed states, using the View menu in the Model Window.
Let’s begin. Start by reading a sample file that is designed to show each of the graphical windows. The following is a copy of that model.
; GPSS World Sample File - SAMPLE9.GPS
Pool STORAGE 400
;Define Storage
Matrix1 MATRIX ,5,5
;Define Matrix
Transit TABLE M1,200,200,20 ;Transit time in wait
; and process
GENERATE
(Exponential(1,0,100)) ;Uses built in
; Exponential dist.
JOIN Maingrp ;Xact joins
Maingrp
JOIN
Numgrp,9999 ;Add 9999 to Numeric group
SAVEVALUE Addup+,1
;Total of Transactions
; in model
ASSIGN Param_1,232
;Assign Xact parameter
JOIN
Numgrp,P$Param_1 ;Put value in Param1
; in Numgrp group
LOGIC S Switch_1
;Turn on a logic switch
MSAVEVALUE Matrix1,2,2,QA$Tot_Process ;Put avg.
queue
; content in matrix cell
QUEUE Tot_Process
;Queue for process time
SEIZE
Facility1 ;Own first Facility
LINK
Chain1,FIFO,Nxtblk ;Put on Userchain if
; Facility busy
Nxtblk SEIZE Facility2
;Own a second Facility
SEIZE
Facility3 ;Own a third Facility
QUEUE
Process_Time ;Keep track of process
; times
ADVANCE 100,(Exponential(1,0,50)) ;Uses built in
; Exponential Dist.
DEPART
Process_Time ;Record length of
; process
TABULATE Transit
;Add wait + process
; time to Transit ; Table
RELEASE Facility1
;Give up 1st Facility
ADVANCE 20
;Delay time for Fac 2&3
RELEASE Facility2
;Give up 2nd Facility
ADVANCE 10
;Extra delay time-Fac 3
RELEASE Facility3
;Give up 3rd
Facility
DEPART
Tot_Process ;Leave Queue
UNLINK
Chain1,Nxtblk ;Take all waiting Xacts
; off Userchain
ENTER
Pool,100 ;Place 100 units in the
; Storage
LOGIC R Switch_1
;Turn off logic switch
LEAVE Pool,50
;Take 50 units
from
; Storage
SAVEVALUE Collect-,1
;Show negative Savevalue
; in model
REMOVE
Maingrp ;Remove Xact from group
; Maingrp
ADVANCE 10
;Wait 10 time units
LEAVE
Pool,50 ;Take 50 units from
; Storage
Finis TERMINATE 1
;Destroy Xact
Open the model in the Model Window of GPSS World.
CHOOSE
File / Openand
SELECT
SAMPLE9and
SELECT
Openthen create the simulation.
CHOOSE
Command / Create Simulationand
CHOOSE
Command / CustomNow, in the dialog box
TYPE
Stop 5SELECT
OK
This will stop Transaction number 5 when it becomes active. Now we are ready to look through the graphical windows.
The Blocks Window
Open the Blocks Window
CHOOSE
Window / Simulation Window / BlocksWindowCHOOSE
View / Entity DetailsYour screen should look something like this:

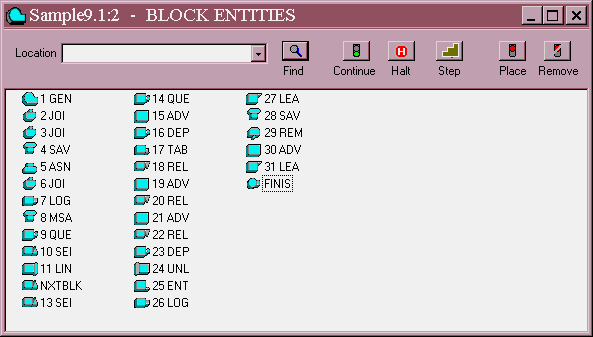
Figure 11—1. The Non-Detailed View of the Blocks Window
You are looking at the non-detailed View of the Blocks Window. This is a high level overview of the model. When you are debugging a model, a gross view of the Transaction flow may be all you need at first. If not, more details are available by shifting to the detailed view.
Now let’s start the simulation.
From the Main Menu
CHOOSE
Command / STARTand in the dialog box replace the 1
TYPE
1111111111,NPand
SELECT
OKThe simulation will stop when Transaction 5 becomes active. Now, before we continue, let’s step through the simulation.
By using the [F5] key we will be able to watch the Transactions move from Block to Block. As we learned earlier, Function Keys can be set to specific commands in the Function Keys Page of the Model Settings Notebook. The default setting for [F5] is STEP 1.
PRESS
[F5]Did you see Transaction 5 enter the GENERATE Block? Good. The GENERATE Block is now highlighted.
Now let’s send Transaction 5 directly to the TERMINATE Block by using Manual Simulation.
In the Main Window Menu
CHOOSE
Command / Customin the dialog box
TYPE
Transfer ,FinisSELECT
OKNote that if you pressed [Enter] here, the dialog box didn’t close. This is because in the Custom Command dialog box, you can type in multi-line commands. You must Select OK in this dialog box. Now, make sure you can see the final Block in the model labeled Finis, then
PRESS
[F5]Did you see the Transaction enter the TERMINATE Block? During the design and testing phases of model development, the Blocks Window can give you a quick and easy way to discover problems in Transaction flow. You can test alternate paths for Transactions and the effect they have on the simulation’s behavior.
Now that the Stop Condition is removed from the simulation, since Transaction 5 has been TERMINATEd, let’s start the simulation again. First, put a Stop Condition on the ADVANCE Block. Position the mouse pointer over the ADVANCE Block (Block 15) and click mouse button 1. The Block is now selected. Now, in the Blocks Window
CLICK ON The Place icon in the Debug Toolbar
and
PRESS
[F2]The simulation will run until a Transaction is ready to enter the ADVANCE Block. Now step through the simulation.
PRESS
[F5]several times and watch the Transaction move from Block to Block. Now look at the Journal Window and step through a few more Blocks.
First, make the Journal Window the active window
CLICK ON Any Part of the Journal Window
then
PRESS
[F5]
a few more times. Notice how trace messages are recorded in the Journal Window as you use the STEP Command. Your Journal Window should look something like this.
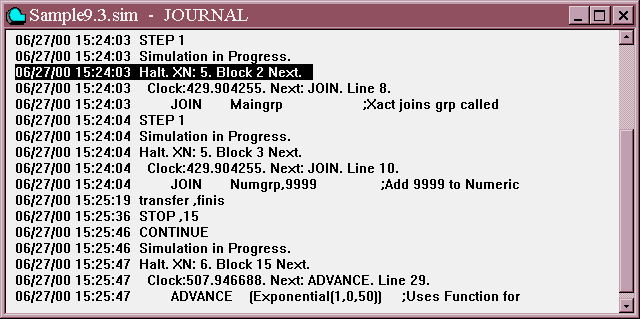
Figure 11—2. The Journal Window after Stepping.
Now switch to detailed view in the Blocks Window and look at a history of what has happened so far by examining the Block entry counts. Notice that it gives you all the information that you would see in a Standard Report. Make sure the Blocks Window has the focus. Now, from theMain Menu
CHOOSE
View / Entity Details
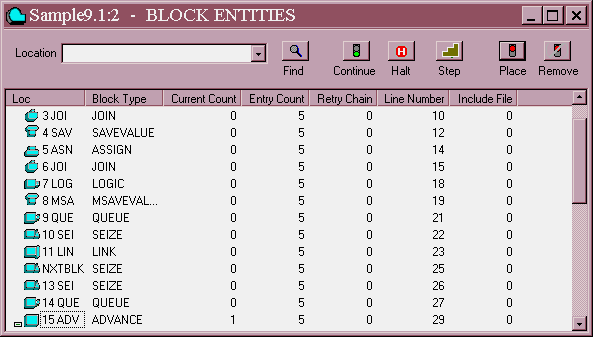
Figure 11—3. Detailed View of the Blocks Window.
At this time, please refer to Chapter 4 of the GPSS World Reference Manual. Please read the section on GPSS Block Entities. You should identify each item in the Blocks Window on your screen.
Now, before we leave this section, let’s take off all Stops Conditions. In the Main Menu
CHOOSE
Window / Simulation Snapshot /User StopsCLICK ON The Remove All button
SELECT
OKand
PRESS
[F2]As the simulation runs, watch it in either view of the Blocks Window. Both forms of the Blocks Window can be useful. Sometimes you will want to see where Transactions are accumulating, other times you will want to have a much more detailed accounting of the number of Transactions in different Blocks.
There are a few other menu items to examine. The File Menu will allow you to save the simulation at any point in time. File / Print from the Main Menu will print the window that has the focus when you issue the command. Let’s try printing the window. You can do this while the simulation is running, but it is best to halt the simulation so you know exactly what you are printing. Make sure your printer is on and ready to print.
PRESS
[F4]and
CHOOSE
File / PrintNow you have hard copy of the window you selected. Had you chosen to save the simulation at this point in time, you could open it later to print any of the windows related to the current state of the simulation.
Help is found in all the windows. If you have questions about Help, please refer to Lesson 3 in this manual.
If you want to have a window easily available for viewing, you could minimize it using the Windows minimize button. That is the button with the short horizontal line inside it and is found in the upper right of the window. Then, later, you can click on the icon in the lower left of the Main Window to reopen it. You should remember that minimized windows are still updated on-line. This means that although you cannot see the window, the simulation must proceed slowly in order to keep updating it.
Let’s minimize the Blocks Window
CLICK ON The Minimize Button-Upper Right of Window-Button
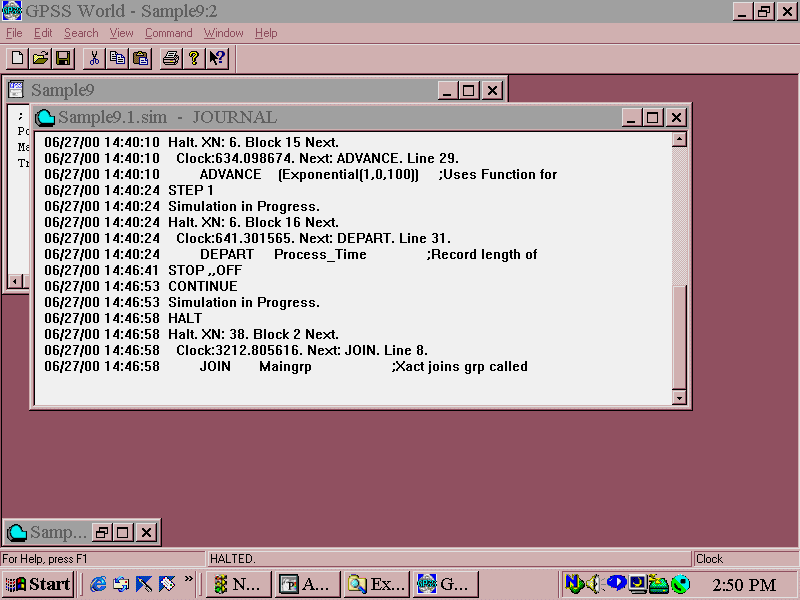
Figure 11—4. The Main Window with Blocks Window minimized.
CLICK ON The Minimized Blocks Window Icon-lower left of Main Window
The Blocks Window is now expanded again. Now let’s close it .
CLICK ON The X-Upper Right of Blocks Window
The Facilities Window
Now start the simulation running again by using the Continue Command. Remember it is loaded into Function Key [F2]. If you are just starting at this point, you will have to read the SAMPLE9 model and Create the Simulation as we did when we were learning about the Blocks Window.
With the simulation running, open the Facilities Window
CHOOSE
Window / Simulation Window / Facilities WindowYour screen should look something like this:

Figure 11—5. Facilities Window. Detailed View.
You will notice that this window opened in the detailed view. You will see that this is true for all the graphical windows. You will find in most of these windows you will need the detailed information when debugging or testing. However, there will be times when you just want a high level view of what is going on.
At this time, please refer to Chapter 4 of the GPSS World Reference Manual, and read the section on Facility Entities. You should identify each item in the Facilities Window on your screen.
Welcome back. Switch to the non-detailed view of the Facilities Window. In the Facilities Window menu
CHOOSE
View / Entity DetailsThis will toggle the view from detailed to the non-detailed View.
Notice how the simulation causes the state of the Facility to change. In this simple model the Facility symbol changes from gray, when it is not busy, to red, when it is. A small queue shows as a small white bar in the right side of the icon. A larger white bar is displayed when the queue exceeds 10 Transactions in size. You can change it yourself in Manual Simulation mode. The queue that you see in this window is really a count of Transactions on the Facility Delay Chain that are waiting to seize the Facility.
Let’s put the Facility Entity named Facility out of action, but first halt the simulation to see the change more clearly.
PRESS
[F4]CHOOSE
Command / CustomIn the dialog box
TYPE
FUNAVAIL Facility1SELECT
OKDid you see the Facility Icon turn yellow? Good. Now look at the Detailed View.
CHOOSE
View / Entity DetailsWatch the Delay Chain in the Facilities Window. In the Main Menu
CHOOSE
Command / CustomTYPE
STEP 150SELECT
OKand watch the waiting line of Transactions build up on the Facility Delay Chain.
O.K. Let’s allow the Facility to process the waiting Transactions.
CHOOSE
Command / CustomIn the dialog box
TYPE
FAVAIL Facility1This makes the Facility available again. Start the simulation running again.
PRESS
[F2]Do you see the waiting line decrease? Actually, you can use Manual Simulation to manipulate entities in any graphical window.
PRESS
[F4]Now it’s time to move on to the Matrix Window, but first, close the Facilities Window.
CLICK ON The X-Upper Right of the Facilities Window
The Matrix Window
If you’re just starting here, you will also need to open SAMPLE9.
Now, open the Matrix Window.
CHOOSE
Window / Simulation Window / Matrix WindowThis opens a dialog box that asks for the name of the Matrix.
Your screen should look something like this:
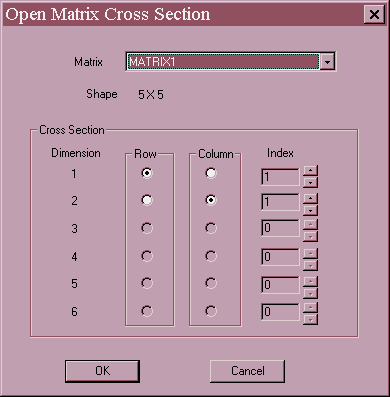
Figure 11—6. The Open Matrix Dialog Box.
Since there is only one Matrix in this model, its name already appears in the drop-down box.
SELECT
OKIf you still have the simulation halted from the previous section of this lesson, start it running again by issuing a Continue command--press [F2].
You’ll now see Matrix1 displayed. Watch the cell at location row 2, column 2 change as Transactions pass through the MSAVEVALUE Block and the Average Queue Content is placed in the Matrix.
Your screen should look something like this:
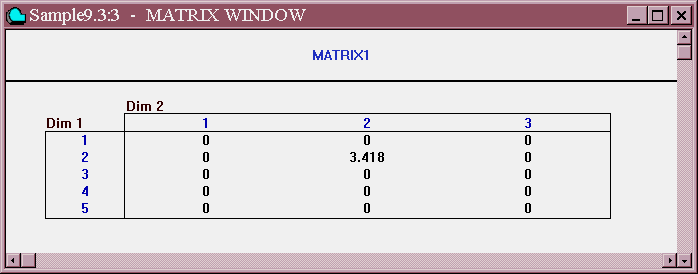
Figure 11—7. The Dynamic Matrix Window.
You can adjust your Matrix Window to make all the elements of the default cross section visible. There are scroll bars for viewing larger cross sections. Let’s use Manual Simulation to change one of the cells in the matrix. Now, Halt the simulation.
PRESS
[F4]CHOOSE
Command / Customand in the dialog box
TYPE
MSAVEVALUE MATRIX1,3,3,1000SELECT
OKMake sure that the Matrix Window is large enough for you to see Column 3. Did you see the matrix element, at Row 3, Column 3, receive a new value? Good. You can use Manual Simulation to experiment with values and the effect on your simulation when you are designing your model. Remember, Manual Simulation acts as if the Active Transaction were lifted from the simulation and passed through the Block of your choosing and then put back to take up where it left off.
GPSS World allows Matrices to be defined with up to 6 dimensions! When you view such a beast, you must select which cross section you want to view. This is done by using
View / Cross Section in the Matrix Window to open the Cross Section Dialog. Let’s try it.CHOOSE
Command / CustomIn the dialog box
TYPE
MATRIX2 MATRIX ,2,3,4,2,2,2This will define a 6 dimensional Matrix.
SELECT
OKNow, open the Matrix Window.
CHOOSE
Window / Simulation Window / Matrix WindowThis opens a dialog box that asks for the name of the Matrix.
CLICK ON Matrix2 from the drop-down box
Your screen should look something like this:
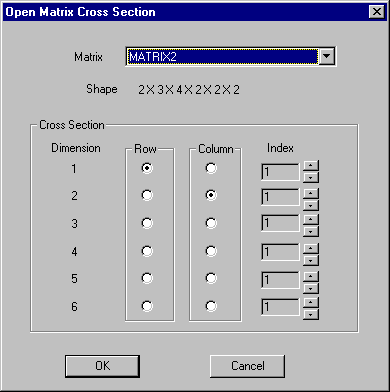
Figure 11—8. The Open Matrix Cross Section Dialog.
The extent of all dimensions is given under the name of the Matrix. Notice that the default view is to use Dimension 1 across the rows of the cross section, and dimension 2 across the columns. The remaining dimensions are set to the first element in each direction.
If you want to change the visible cross section, here’s what you do. First, choose which dimensions will be used as row and columns in the Matrix Window. Inside the Cross Section Group Box of the Dialog, click in the "Row" column to choose the dimension to be used for rows, and in the "Column" column to choose the dimension to be used across columns. Finally, for each of the remaining dimensions, select the index where the cross section is to cut the respective dimension. Do this by filling in the entry fields in the right most column of the Dialog.
SELECT
OKThis brings the selected cross section into view.
Actually, you can open many cross sections of a single Matrix. It’s easy. Just open a new Matrix Window for each cross section.
At this time, please refer to Chapter 4 of the GPSS World Reference Manual. Please read the section on the Matrix Entities.
Welcome back. Now, let’s move to the Storages Window, but first close the Matrix Window.
CLICK ON The X-Upper Right Matrix Window
The Storages Window
Begin by starting the simulation again. If you are just starting here, you will have to go back to the Blocks Window description and Open the model, Create the Simulation, and start SAMPLE9 running.
PRESS
[F2]While the simulation is running, open the Storages Window
CHOOSE
Window / Simulation Window / Storages WindowYour screen should look something like this:

Figure 11—9. The Storages Window.
PRESS
[F4]At this time, please refer to Chapter 4 of the GPSS World Reference Manual. Please read the section on the Storage Entities. You should identify each item in the Storages Window on your screen.
Welcome back. You undoubtedly noticed how the simulation caused the state of the Storage Entity to change. You can change it yourself in Manual Simulation mode.
Let’s put the Storage Entity named Pool out of action. In the Main Menu
CHOOSE
Command / CustomIn the dialog box
TYPE
SUNAVAIL PoolSELECT
OKDid you see the Storage Icon turn yellow? Good. Note the content of the Storage Delay Chain and then in the Main Menu,
CHOOSE
Command / Customand in the dialog box, replace the 1
TYPE
Step 150then
SELECT
OKand watch the waiting line of Transactions build up on the Storage Delay Chain..
O.K. Let’s allow the Storage Entity to process the waiting Transactions.
CHOOSE
Command / CustomIn the dialog box
TYPE
SAVAIL PoolThis makes the Storage available again. To prevent other Transactions from bucking the line, GPSS World immediately gives as many Transactions on the Delay Chain the storage space they are requesting, but moves them no further in the simulation until it is their turn. That’s why you see four Transactions go into the ENTER Block and the Delay Chain decrease by 4. Start the simulation running again.
PRESS
[F2]Do you see the waiting line decrease? You can use Manual Simulation to manipulate entities in any graphical window.
Let’s move now to the Table Window, but first close the Storages Window.
CLICK ON The X-Upper Right Storages Window
The Table Window
Begin by starting the simulation again. If you are just starting here, you will have to go back to the Blocks Window description and Open the model, Create the Simulation, and start SAMPLE9 running.
First, let’s halt the simulation
PRESS
[F4]CHOOSE
Window / Simulation Window / Table WindowThis opens a dialog box with the Table names in a drop-down box.
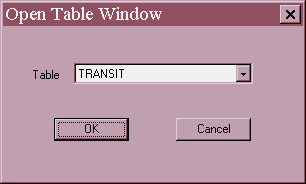
Figure 11—10. The Open Table Dialog.
Transit is already showing in the drop-down box. This is the only Table in this model, but if there were multiple Tables, you could select the one that you wanted from the drop-down box.
SELECT
OKYou’ll now see Table1 displayed, but there is no histogram just an X and Y axis. Let’s start the simulation and watch the histogram develop. Make sure you have the window open to a large enough size so the you can clearly see the bars of the histogram as they grow. The simulation need not be stopped to resize the window if there is a problem with its appearance.
PRESS
[F2]to start the simulation running again.
Your screen should look something like this.
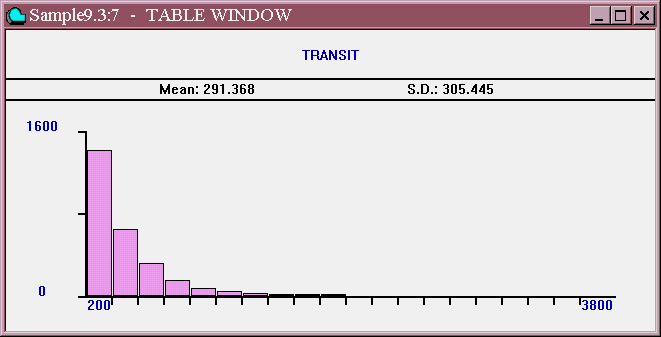
Figure 11—11. The Table Window.
At this time, please refer to Chapter 4 of the GPSS World Reference Manual. Please read the section on GPSS Table Entities. You should identify each item in the Table Window on your screen.
Halt the simulation while you look at the GPSS World Reference Manual.
PRESS
[F4]Welcome back. When you’re ready to continue,
PRESS
[F2]Notice how the simulation causes the state of the histogram to change. As the counts in each frequency class are increased, the average and standard deviation change. When the histogram becomes too tall, GPSS World rescales it automatically.
To create a histogram for the Table Window, you need only define it with a TABLE or QTABLE Command. GPSS World will show its state automatically.
Now, on to the Plot Window, but first halt the simulation and close the Table Window.
PRESS
[F4]and
CLICK ON The X-Upper Right of the Tables Window
The Plot Window
If you are just starting here, you will have to go back to the Blocks Window description and Open the model, Create the Simulation, and start SAMPLE9 running. and immediately halt it by pressing [F4].
Now, with the simulation halted, we’ll plot a few variables. GPSS World allows you to plot up to eight variables simultaneously in each Plot Window. Note that it is not necessary to halt a simulation in order to define a Plot, but it is probably less distracting to do so.
Now, let’s open the Plot Window. You'll note that the Edit Plot Window has some similarities to the Expression Window. Lesson 2 describes the use of the Plot and Memorize buttons. Review them now if you need to.
CHOOSE
Window / Simulation Window / Plot WindowThe Edit Plot Window dialog box will appear as shown below.
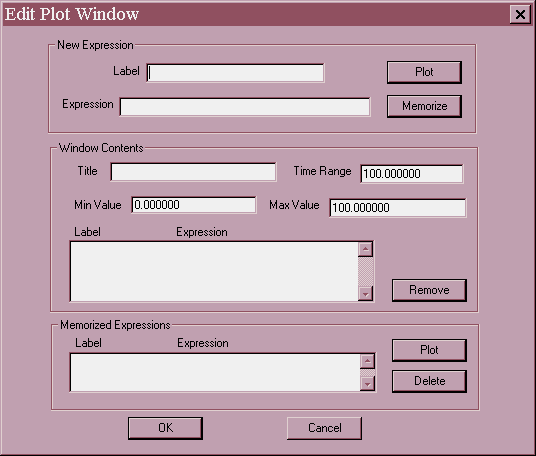
Figure 11—12. The Edit Plot Window.
The Edit Plot Window has two purposes. You can use it to do nothing other than set up the axes and other general values, and you can use it to specify each additional Expression to be included in the plot.
To make each entry, you should position the mouse pointer at the beginning of the appropriate line and click once. You can also use the [Tab] to move in a forward direction from box to box. Don’t use [Enter] to jump to the next field in the box since it will close the dialog box, and give you an error. You will use [Enter] or Select OK when all information in the box is completed.
The Label field should contain the Label to be used in the legend at the bottom of the plot.
TYPE
Storage in Usein the Label field.
In the Expression box which indicates the first variable to be plotted
TYPE
S$PoolIn the Plot Title field we’ll choose a name that will describe both items that we want to plot, namely the Total_Time queue size and the average time in the queue which will be the total time from generation to termination in this simulation.
TYPE
Storage in Use & Process Timein the Title box.
The time range for each view of the plot must be added. You will want to make this time duration long enough so that it does not flash by as the simulation runs, but not so long that your plot is jammed together. You may have to experiment once or twice to get the correct value. The Plot Window will page horizontally when it reaches the end of the window.
You should also be aware that a limited number of plot points are saved for redrawing the Plot Window. The default is to save no more than the last 10,000 points for each plotted expression. If you resize the Plot Window and the leftmost part of the plot is not redrawn, you should increase the number of saved plot points in the Model Settings Notebook. Usually, 10,000 points is sufficient to completely restore displayed points. If you refresh or resize your window or do anything that causes the window to refresh automatically such as dragging another window over the top of the Plot Window, only the remembered points can be redisplayed. Of course, the more points you save, the more memory you will use for this purpose. Since GPSS World makes huge amounts of virtual memory available to you, this is usually not a problem.
Now, let’s put in the time range for the X-axis. In the Time Range box
TYPE
10000Finally, the Y-axis values have defaults of 0 and 100. Let’s change only the Max value to 200.
TYPE
200CLICK ON The Plot Button
If we save this simulation and want to plot these again, these values will be easily available. So
CLICK ON The Memorize Button
Now, let’s enter a second set of values for the same plot,Don’t forget to position the cursor with the mouse and don’t use [Enter] between fields. Drag and hold down the right mouse button over the current Label. For the Label
TYPE
Process Timeand for the Expression repeat the process and
TYPE
QT$Process_TimeCLICK ON The Plot Button
CLICK ON The Memorize Button
Good. We're done now.
SELECT
OKThe Plot Window should look like this:
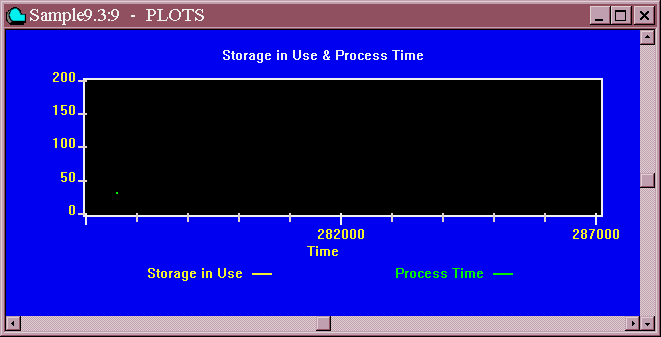
Figure 11—13. The Plot Window.
and then start the simulation running.
PRESS
[F2]Your Plot Window should look something like this. Of course, it will depend where in simulated time you are when you open the Plot.
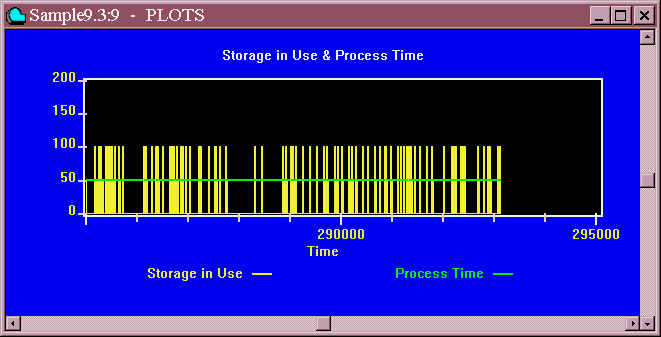
Figure 11—14. The Plot Window with two Expressions being plotted.
You can plot up to eight values at one time by repeating the procedure shown above and continue to add Labels and Expressions and then choose to Plot and/or Memorize them.
Now let's Halt the simulation
PRESS
[F4]Now , close the Plot Window. Make sure the Journal / Simulation Window has the focus.
CHOOSE
File / SaveUnless you've done this before, the name chosen will be sample 9.1.Sim.
CHOOSE
SaveClose all open windows.
Now let's bring back the simulation we just saved..
CHOOSE
File / OpenIn the drop-down box at the bottom of the window
CLICK ON The down arrow in the Files of type box
CHOOSE
Simulationfor the file type and then
CHOOSE
Sample9.1in the top part of the dialog box.
SELECT
OpenWe have now opened the simulation that we saved. let's see if the Plot was saved.
CHOOSE
Window / Simulation Window / Plot WindowYou'll see the values that we chose to memorize. In the Memorized Expressions box
CLICK ON The first Label and then Plot
then
CLICK ON The second Label and then Plot
Add the Title "Storage in Use and Process Time" and the time range of 10000. Finally, complete the definition with the Max Value of 200 and the Plot is ready to display information as the simulation continues to run from the point where we saved it.
PRESS
[F2]to continue running the simulation and when you have observed the Plot for as long as you wish, halt the simulation
PRESS
[F4]Before leaving this section, please close the Plot Window or minimize it if you think you may still want to view it in the immediate future. Remember that even a minimized on-line window slows down the simulation.
The next two windows are relatively simple ones, but can be very useful. Let’s look at Logicswitches and Savevalues.
The Logicswitches and the Savevalues Windows
If you are just starting here, you will have to go back to the Blocks Window description and Open the model, Create the Simulation, and start SAMPLE9 running. and immediately halt it by pressing [F4].
Open both the Logicswitches and Savevalues Windows. Move them on your screen so you can see both of them completely.
CHOOSE
Window / Simulation Window / Logicswitches Windowthen
CHOOSE
Window / Simulation Window / Savevalues Window
To view all windows without overlap
CHOOSE
Window / Tile
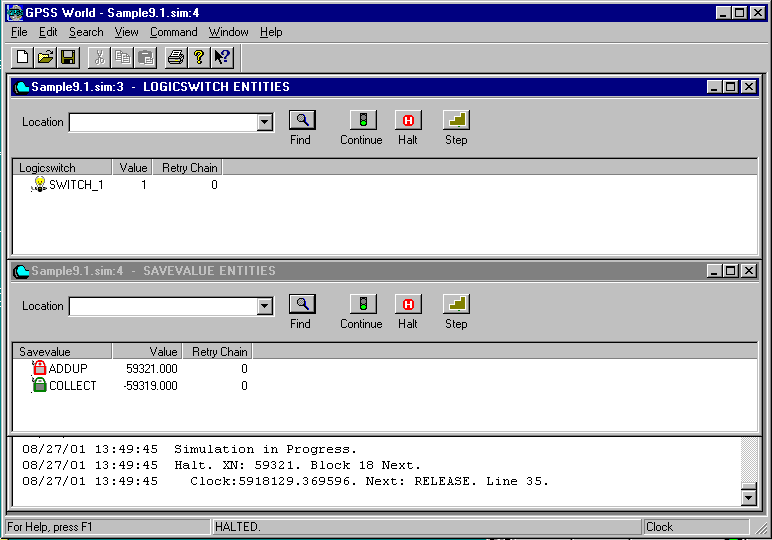
Figure 11—15. The Logicswitches and Savevalues Windows.
Now let’s step through the simulation and watch the values change.
PRESS
[F5]several times and watch the values change. Move over to non-detailed view. In the menu of either window or both
CHOOSE
View / Entity Detailswhile each window has the focus.
You’ll see there isn’t really much difference in the Logicswitches Window. In the Savevalues Window you can see the actual value in the detailed view whereas in the non-detailed view, you see only if the Savevalue is positive, negative, or zero. After the simulation begins, we don’t have any Savevalues with a zero value.
Your screen should look like this.
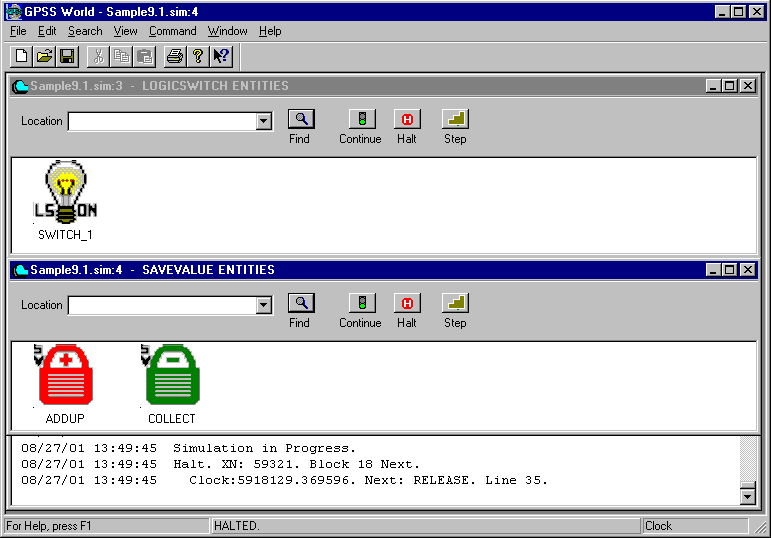
Figure 11—16. The Logicswitches and Savevalues Windows. Non-Detailed View.
Before leaving this section, close the Savevalues and Logicswitches Windows. If you think you may want to view them again in the near future, you can minimize them, instead.
Let’s move on to the Queues Window.
CLICK ON The X-Upper Right Savevalues Window
CLICK ON The X-Upper Right Logicswitches Window
The Queues Window
If you are just starting here, you will have to go back to the Blocks Window description and Open the model, Create the Simulation, and start SAMPLE9 running. If you are continuing
PRESS
[F2]to start the simulation running again. Then
CHOOSE
Window / Simulation Window / Queues Window
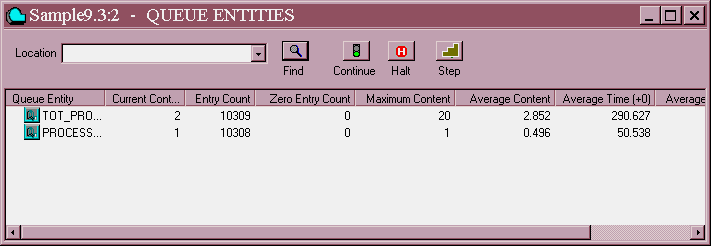
Figure 11—17. The Queues Window in Detailed View.
You will see the detailed view of the Queue Entity. In this model a Queue Entity has been used in a slightly different way than usual. We often think of a queue as a waiting line for a resource. In this model we are using the Queue Entity to collect the processing time as well as the wait time. Remember that QUEUE and DEPART Blocks simply gather statistics and do not contain a chain of Transactions. The individual resources like Facilities and Storages have chains that hold Transactions waiting to use them. The QUEUE and DEPART Blocks collect information about time durations and chain lengths when used in conjunction with these resources.
At this time you may wish to halt the simulation and step as we have in the previous windows watching the changes to the Queue. To do this you would
PRESS
[F4]then
PRESS
[F5]several times.
Take some time at this point to look at the description of the information displayed by reading about GPSS Queue Entities in Chapter 4 in the GPSS World Reference Manual.
You might also want to study the Queue in the non-detailed view. It shows you if there is a zero Queue content or a small, medium or large queue. The last three states of the Queue are indicated by the white bar that grows in size on the right hand side of the Queue icon.
CHOOSE
View / Entity DetailsBefore going on, don’t forget to close the Queues Window.
CLICK ON The X-Upper Right of the Queues Window
The Expressions Window is next. For former GPSS/PC users, this is the replacement and expansion of Microwindows
tm. You can now view as many values as you wish. Let’s see how it works.
The Expressions Window
If you are just starting here, you will have to go back to the Blocks Window description and Open the model and Create the Simulation. Don't start the simulation running just yet.
Open the Expressions Window
CHOOSE
Window / Simulation Window / Expressions WindowThe Edit Expressions Window appears and asks you for the Label and Expression you wish to enter. To make each entry, you should position the mouse pointer at the beginning of the appropriate line and click once. Don’t use [Enter] to jump to the next field in the box since it will close the dialog box, and give you an "invalid Expression" error. You can also use the [Tab] to move from box to box in a forward direction. You will use [Enter] or Select OK when all information in the box is completed.
In the dialog box for the Label
TYPE
Clockand for the Expression
TYPE
AC1
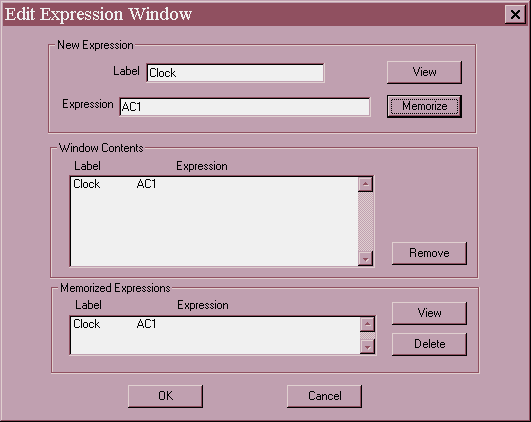
Figure 11—18. The Edit Expressions Window with the first entry.
Just as we did in the Plot Window, you will now choose View and Memorize to display the values with this run of the simulation and also to make them available in future if you save the simulation and want to run it again and be able to view the same Expressions.
CLICK ON The View Button
CLICK ON The Memorize Button
Now, as we did in the Edit Plot Window, you will enter the next two labels and expressions by clicking at the end of the current value in the box and holding down the left mouse button and dragging over the current value. You can then type in the new value. Don't forget to click on View and Memorize after each set of values are entered.
In the dialog box for the Label replace the last label
TYPE
Active Transactionand replace the last Expression
TYPE
XN1then
CLICK ON The View Button
CLICK ON The Memorize Button
Finally, to add the last Label and Expression
In the box for the Label replace the last label
TYPE
Wait + Processand replace the last Expression
TYPE
Q$Tot_Processthen
CLICK ON The View Button
CLICK ON The Memorize Button
SELECT
OKWe now will be able to view the Clock, Active Transaction Number, and size of the Tot_Process Queue while the simulation runs.

Figure 11—19. The Expressions Window.
Now start the simulation and watch the values change.
PRESS
[F2]After you have viewed the Expressions Window, close it.
CLICK ON The X-Upper Right Expressions Window
Now, reopen the window.
CHOOSE
Window / Simulation Window / Expressions WindowNotice that in the Edit Expressions Window you can choose the values you wish to now be displayed by clicking on the value and then on the View Button in the Memorized Expressions Box. You may have to click on the up or down arrow to see all the Memorized Expressions in the box.
CHOOSE
Active Transactionthen
CLICK ON The View Button
SELECT
OKYou now see an Expressions Window that is displaying the value of the active transaction.
PRESS
[F4]to halt the simulation.
CLICK ON The X-Upper Right Expressions Window
You can also enter values in the Settings Notebook on the Expressions page for any model. Whenever you Create a Simulation, these memorized values will be available when you want to open a new Expressions or Plots Window. Then you can pick and choose which ones you want to view.
The Snapshot Windows
If you are just starting here, you will have to go back to the Blocks Window description and Open the model, Create the Simulation, and start SAMPLE9 running and halt it by pressing [F4] once it is running. If you are continuing leave the simulation halted.
The Snapshot Windows act like a camera inside your simulation. They preserve a single instant in the life of the simulation. They are not updated on-line like the dynamic windows that we have just studied.
Let’s take a look at a Current Events Chain Snapshot. We will look at this snapshot and then choose a particular Transaction by number, so we can see how the Transaction Snapshot works. With the simulation halted we can use the same Transaction for two different snapshots.
CHOOSE
Window / Simulation Snapshot / CEC SnapshotYour window should look something like this:

Figure 11—20. The CEC Snapshot.
In this view, you see transactions grouped by priority.
Wherever you see a plus, you can click for more information and expand the view. The first plus when clicked on will expand to show you the individual Transactions on the chain in the form of flags. The second plus next to the flag will open up the parameters of that Transaction. They are represented by pennants. The Expanded Views are shown below. First, you will see the icon representing the chain. In the next view you will see the Transactions represented as flags, after you have clicked on the + sign. Finally, you will see Transaction parameters for any Transaction with a plus sign which you expanded.

Figure 11—21. The Expanded View of the CEC Snapshot-Two Views.
Now, pick a Transaction number from the Transactions you see on the Current Events Chain so you can use it to view the Transaction Snapshot Window.
CHOOSE
Window / Simulation Snapshot / Transaction Snapshotand in the dialog box, type the Transaction number that you chose from the Current Events Chain. You could get a Transaction number from a trace message or error message. In fact, we are only using the number from the CEC as a convenient source of a Transaction currently in the simulation.
Your dialog box should look something like this:
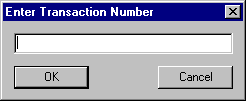
Figure 11—22. The Open Transaction Snapshot Dialog

Figure 11—23. The Transaction Snapshot in Expanded View.
You will see that the Transaction detail line has information on the current time; priority; current Block; next Block number, type and line number; and Assembly Set number. But what if you need to know about the parameters? They aren’t displayed. To see the Transaction parameters, in the Transaction Snapshot Window
CLICK ON The + Sign
You will see the window is similar to the CEC Snapshot. Once again, a click on a plus sign opens up more information. If you click on a minus sign it closes the sub-display.

Figure 11—24 The Expanded View of the Transaction Snapshot.
We will leave you at this point to open the FEC Snapshot, Transaction Groups and User Chains. Their format is all basically the same.
Numeric Groups are shown a little differently. Let’s look at the numeric group in this simulation.
CHOOSE
Window / Simulation Snapshot / Numeric Group SnapshotYou Will see the Numeric Group, "NUMGRP", but no details.
CLICK ON The
+ Sign

Figure 11—25. The Numeric Groups Window Expanded View.
You see that there are two values that we have added to the Numeric Group in our simulation. Usually, you would be adding values from Transaction parameters or setting up some initial values at the start of the simulation to be used in test situations. In this model, every Transaction adds the same two values to the group, but we are only using this to demo the look of the window.
At this time, you may want to study these Chains and Groups in the GPSS World Reference Manual to better understand the meaning of all the values in the vetailed view. Don’t forget to close all the Snapshot Windows that you have opened once you have examined them or printed them.
Well, we have done a lot in this lesson. We have viewed a running simulation through all the graphical windows except for the FEC Snapshot and the Transaction Groups and Userchains Snapshots. We hope you’ll do those on your own. The SAMPLE9.GPS model has all these entities defined so you can easily view them, now or in the future.
Go ahead and end the GPSS World Session.
CLICK ON The X-Upper Right of the Model Window
and answer the appropriate questions. If asked, you don’t want to save the sample model as we have not made any changes to it that we want to keep.
In the next lesson, we’ll look at the use of Data Streams. They allow a simulation to communicate with the outside world.